 Lucknow Lens
How Lucknow is growing
Short answer: Lucknow is spreading fast onto farmland. In the 992 km² around the city, satellites show about 63 km² of land became built-up between 2017 and 2023, 11 km² a year, and 89% of it had been fields. Almost all of it (86%) is outside the old municipal boundary, in a ring 10–15 km from Hazratganj that is filling up on every side. Inside that boundary, only about 4% of the land is tree canopy.
What the data shows
of land around Lucknow turned into buildings, roads and plots in 6 years (2017–2023): about 1,473 football pitches a year.
See the evidenceof the newly built land had been farmland. Fields in this area shrank from 471 km² to 330 km².
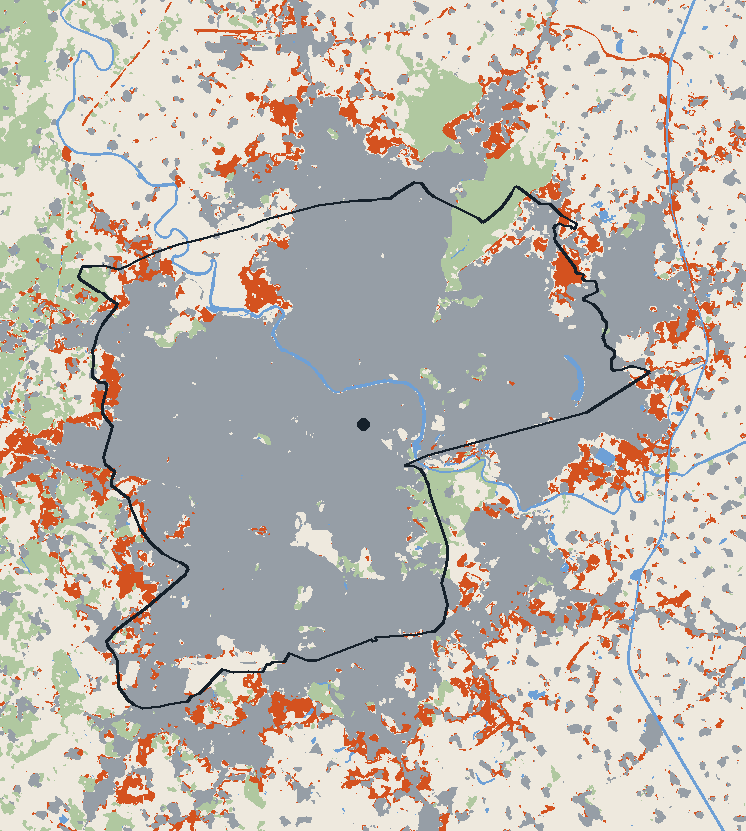
See the evidenceof the new building is outside the old city boundary. 70% of it is 10–15 km from Hazratganj, spread almost evenly in every direction.
See the evidenceof the land inside the city boundary is tree canopy, by the satellite land-cover map; 87% is built-up.
See the evidenceThe evidence
Open any finding to see the charts and numbers behind it.
About 63 km² was built over in 6 years
Esri's annual land-cover maps classify every 10 × 10 m patch of ground from Sentinel-2 satellite images. Over the 992 km² mapped around Lucknow, land classed as built-up grew from 414 km² in 2017 to 509 km² in 2023.
To keep year-to-year misclassification out of the count, a patch only counts as newly built if it was not built-up in both 2017 and 2018, and was built-up in both 2022 and 2023. The yearly totals in the chart are the raw maps, which wobble more.
Most of it was farmland
Of the newly built land, 56 km² (89%) had been fields in 2017, 4 km² open scrub or grassland, and 2.0 km² trees. Farmland in the mapped area fell from 471 km² to 330 km² over the same years.
The city is growing at its edges
9 km² of the new building is inside the old municipal boundary, and 54 km² is outside it. 44 km² of it (70%) is 10–15 km from Hazratganj. No single direction dominates: each eighth of the compass gained between 5 and 8 km² within 15 km.
Within 15 km of Hazratganj, by direction
The city boundary is DataMeet's municipal boundary, an older edition: Lucknow Municipal Corporation has since added villages at its edges, so some of the "outside" growth is now inside the city.
Little tree canopy inside the city
Inside the old city boundary, the land-cover maps class 4.2% of the ground as trees and 87% as built-up in 2023. Street trees, gardens and small groves narrower than a few pixels are often classed as built-up, so the real canopy is somewhat higher. Even so, by these maps less than one patch in twenty inside the city is tree-covered.
Year-to-year changes in the tree share are within the map's error, so this page doesn't claim a trend in either direction.
Quick answers
How fast is Lucknow growing?
Satellite land-cover maps show about 63 km² of land around Lucknow became built-up between 2017 and 2023, about 11 km² a year. 89% of it had been farmland, and 86% is outside the old municipal boundary.
In which direction is Lucknow expanding?
In every direction at once. Between 2017 and 2023, 70% of new building within the area mapped was 10–15 km from Hazratganj, and each direction gained a similar amount (5–8 km² per eighth of the compass).
How much tree cover does Lucknow have?
Inside the old municipal boundary, satellite land-cover maps class about 4% of the land as tree canopy and 87% as built-up (2023). Small trees are often missed at 10 m resolution, so the true figure is somewhat higher.
Method and limits
- Land cover: Esri 10 m Annual Land Cover (produced by Impact Observatory from Sentinel-2), 2017–2023, over the area from 80.80°E to 81.10°E and 26.70°N to 27.00°N.
- New building: a patch counts only if it was not built-up in 2017 or 2018 and was built-up in 2022 and 2023, which filters out one-year misclassifications.
- Boundary: DataMeet's Lucknow municipal boundary (an older edition, before recent extensions).
- Limits: the classifier tends to over-label built-up land (bare plots and roads count), and under-labels small trees. Treat the areas as good to about ±15%; the direction and location of growth are much more certain than the exact km². A longer record back to 1975 (the EU's Global Human Settlement Layer) will be added when its download server is back online.